Knowledge Base
How to View Access Logs in the Customer Portal
Access logs provide a detailed record of every request made to your website. They offer important insights into visitor behavior, site performance, and potential website security risks. By analyzing access logs, you can track unusual activities, such as frequent failed access attempts, and identify IP addresses that are making excessive requests in a brief timeframe, which may suggest possible security threats.
This article will discuss how to view access logs in your HostGator Customer Portal, which can improve your website's security and performance.
To view the access logs:
- Log in to your Customer Portal.
- Click Websites on the left-hand menu.
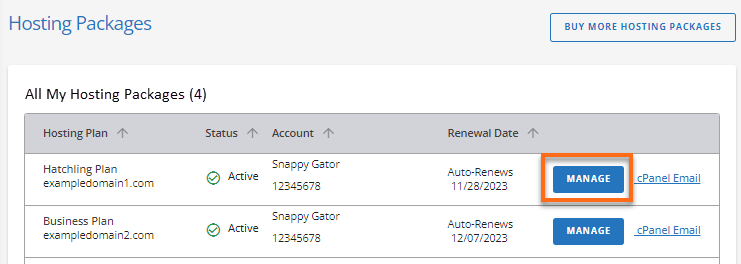
You can also click on the Hosting tab, locate the hosting package you need to manage, and then click its MANAGE button.
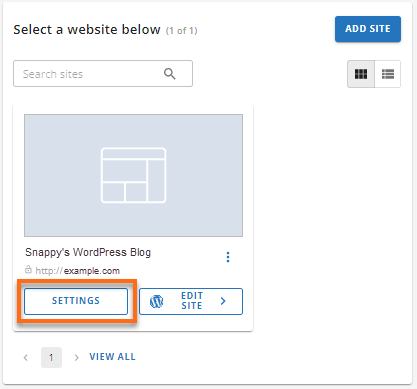
- Locate the website you need to manage and click its SETTINGS button.
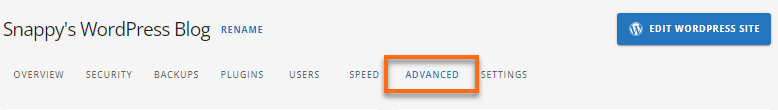
- On the top menu, click the ADVANCED tab.
- Scroll down and look for the Logs card. Click the MANAGE button.
- Under the Logs panel, you will see the following tabs:
- Access Log
- 4xx 5xx Errors
- Activity Log
- PHP Errors
- Click the Access Log tab.
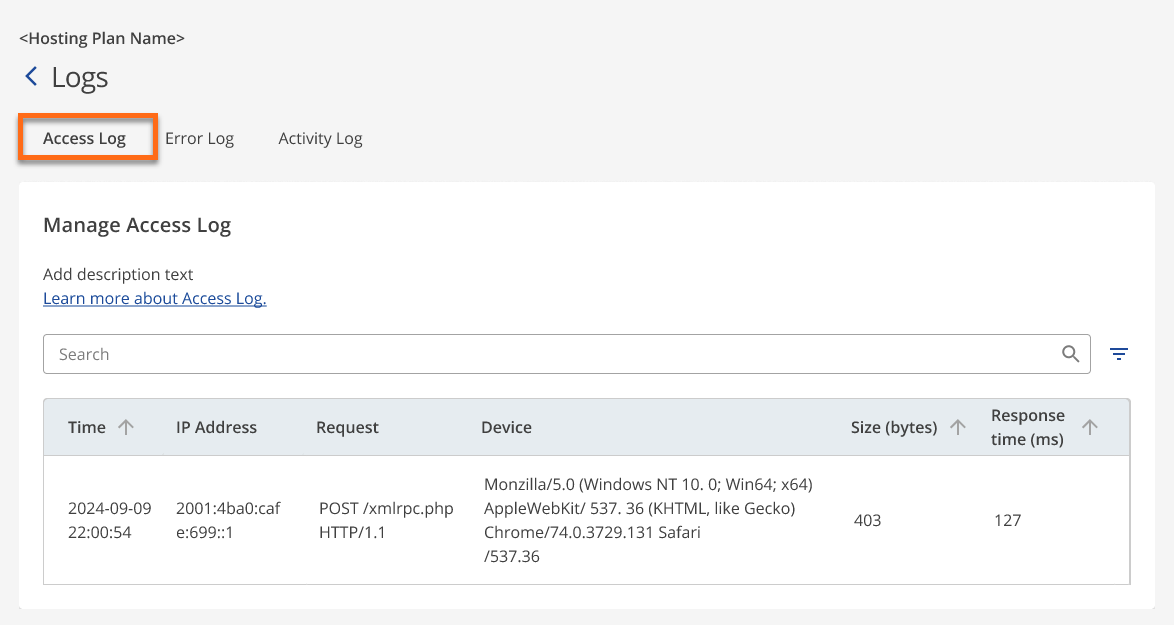
- Under the Access Logs tab, you will find the visitor data with the following information:
- Time: This indicates the date and time when the access request occurred, which is formatted for chronological tracking.
- IP Address: This identifies the device or source requesting access, which is useful for tracking and identifying users or troubleshooting.
- Request: This shows the specific request made to the server and the URL or file being accessed
- Device: This provides the details about the user's browser, operating system (OS), and device type used.
- Size (bytes): The size of the data transferred in the response, measured in bytes.
- Response time (ms): This refers to the time it takes to process a request.
The system keeps logs for at least 30 days, and you can choose to archive or delete them
Did you find this article helpful?