Cloud Sites - Server Usage Dashboard
From the Server Usage Dashboard section of your Customer Portal, you will be able to upgrade your Cloud hosting plan, view your page load speed, server uptime, site availability, and even carefully monitor your CPU and Memory usage.
Access the Server Usage Dashboard
To access your Server Usage Dashboard from your HostGator Customer Portal:
- Click Hosting from your portal's left-hand menu.
- Locate your Cloud hosting package and click Manage.
- Select the Stats tab.
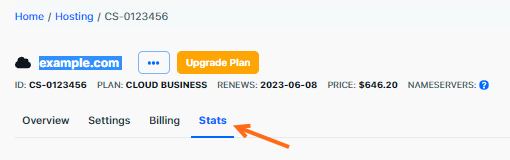
From this Dashboard, you will be able to both monitor the performance of your website as well as upgrade or downgrade your hosting package to match your resources to your usage appropriately.
CPU and Memory Usage Monitor
In this section, you may measure how much of your allotted CPU and Memory your site is using at any given time.
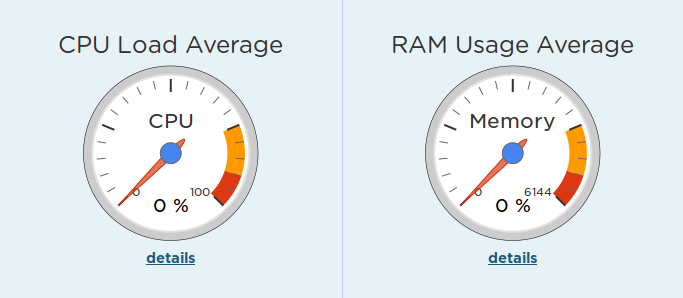
HostGator advises that if your average site load is above 50% or your peak site load is over 70% that you increase your resources to serve your site to visitors better.
Site Availability and Visitor Stats
The next section of your dashboard will provide you with information about which locations in the world your site is accessible from, as well as information about your visitors, the bandwidth they're using, how many visitors you have, and how many times they visited your page.
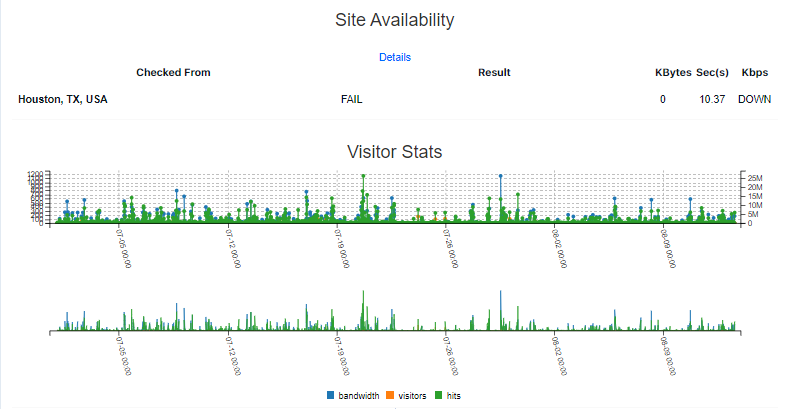
The following statistics are in the Visitors Stats section:
- Bandwidth: The amount of bandwidth your visitors are using.
- Visitors: The number of unique visitors to your site.
- Hits: The number of times visitors access your page.
Page Load Speed and Server Uptime
Cloud Sites provides you with excellent tools to ensure your page is running at the fastest speeds and report your uptime and availability:
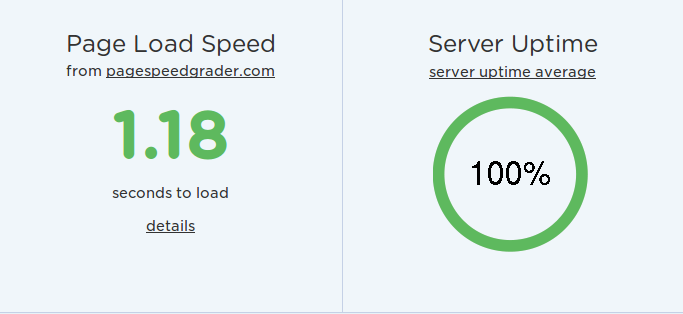
- Page Load Speed: This tells you how quickly your site loads when a visitor attempts to access it.
- Server Uptime: This monitor lets you know your average server uptime